
Data Visualization & Reporting
-

Statistical & Analytical Visualizations
Regression and Model Diagnostics Plots
Hypothesis Testing Visuals (boxplots, bar charts, error bars)
Correlation Plots (scatterplots, trendlines)
Kaplan-Meier Survival Curves
-
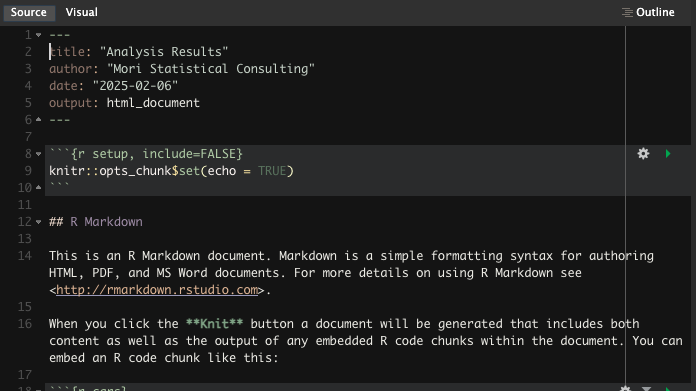
R Markdown Reports
Dynamic Reports in HTML, PDF, and/or Word
Reproducible Reports with Embedded Code
High Resolution Tables and Figures
-

Industry-Specific Reporting
Financial and Market Analysis Reports
Health and Epidemiological Reports
Academic and Research Paper Visualizations
Survey Data and Social Science Reporting
Contact
We’d love to hear from you! Whether you have questions, need support, or want to discuss how we can help with your project, feel free to reach out or book a complimentary consultation.